Sembcorp Marine annual report data extraction 2015-2025
Data source: Sembcorp Marine Annual Report, 2015-2025, 11 copies in total, all from the Investor Relations Station of SGX-listed companiesseatrium.listedcompany.com/annual-reports.html Get the PDF and convert it to text page by page for verification.
Company registration number 196300098Z; SGX code is provided by S51 (Sembcorp Marine) changed to 5E2 (Seatrium, renamed in April 2023).
1. Let’s make one thing clear first: the annual report is not calculated by shipyard.
This is the most important conclusion of this extraction, and it is also the limitation that must be discussed first.
Jurong Shipyard Pte Ltd is a subsidiary in the annual report, not an accounting unit.
Segment reporting in the annual reportbusiness lineDivision:
- Rigs & Floaters
- Repairs & Upgrades
- Offshore Platforms
- Specialized Shipbuilding
Impairment testCash Generating Unit (CGU) Division, there are only two:
"The Group's largest shipyard assets and facilities are (i) integrated shipyards, including sites in Singapore, subcontracting yards in Indonesia and the United Kingdom (singapore cash generating unit); and (ii) Brazilian shipyard (Brazilian Cash Generating Unit). 」
(Original text on page 92 of AR2020)
therefore, There is no such number as "How much money does Jurong Shipyard make in a year?". To regard segment data as Jurong data is to conflate accounting units at two different levels. Search all 7 annual reports Jurong Shipyard … revenue/turnover Entity-level representation of 0 hits.
Jurong has only one piece of verifiable identity information in its annual report: Holding 100% Equity, mainly engaged in "Ship and rig repair, building, conversion and related services" (AR2016 page 273, AR2017 page 276, AR2018 page 316, AR2019 page 224, AR2020 page 206, AR2021 page 192, AR2022 page 202, list of subsidiaries).
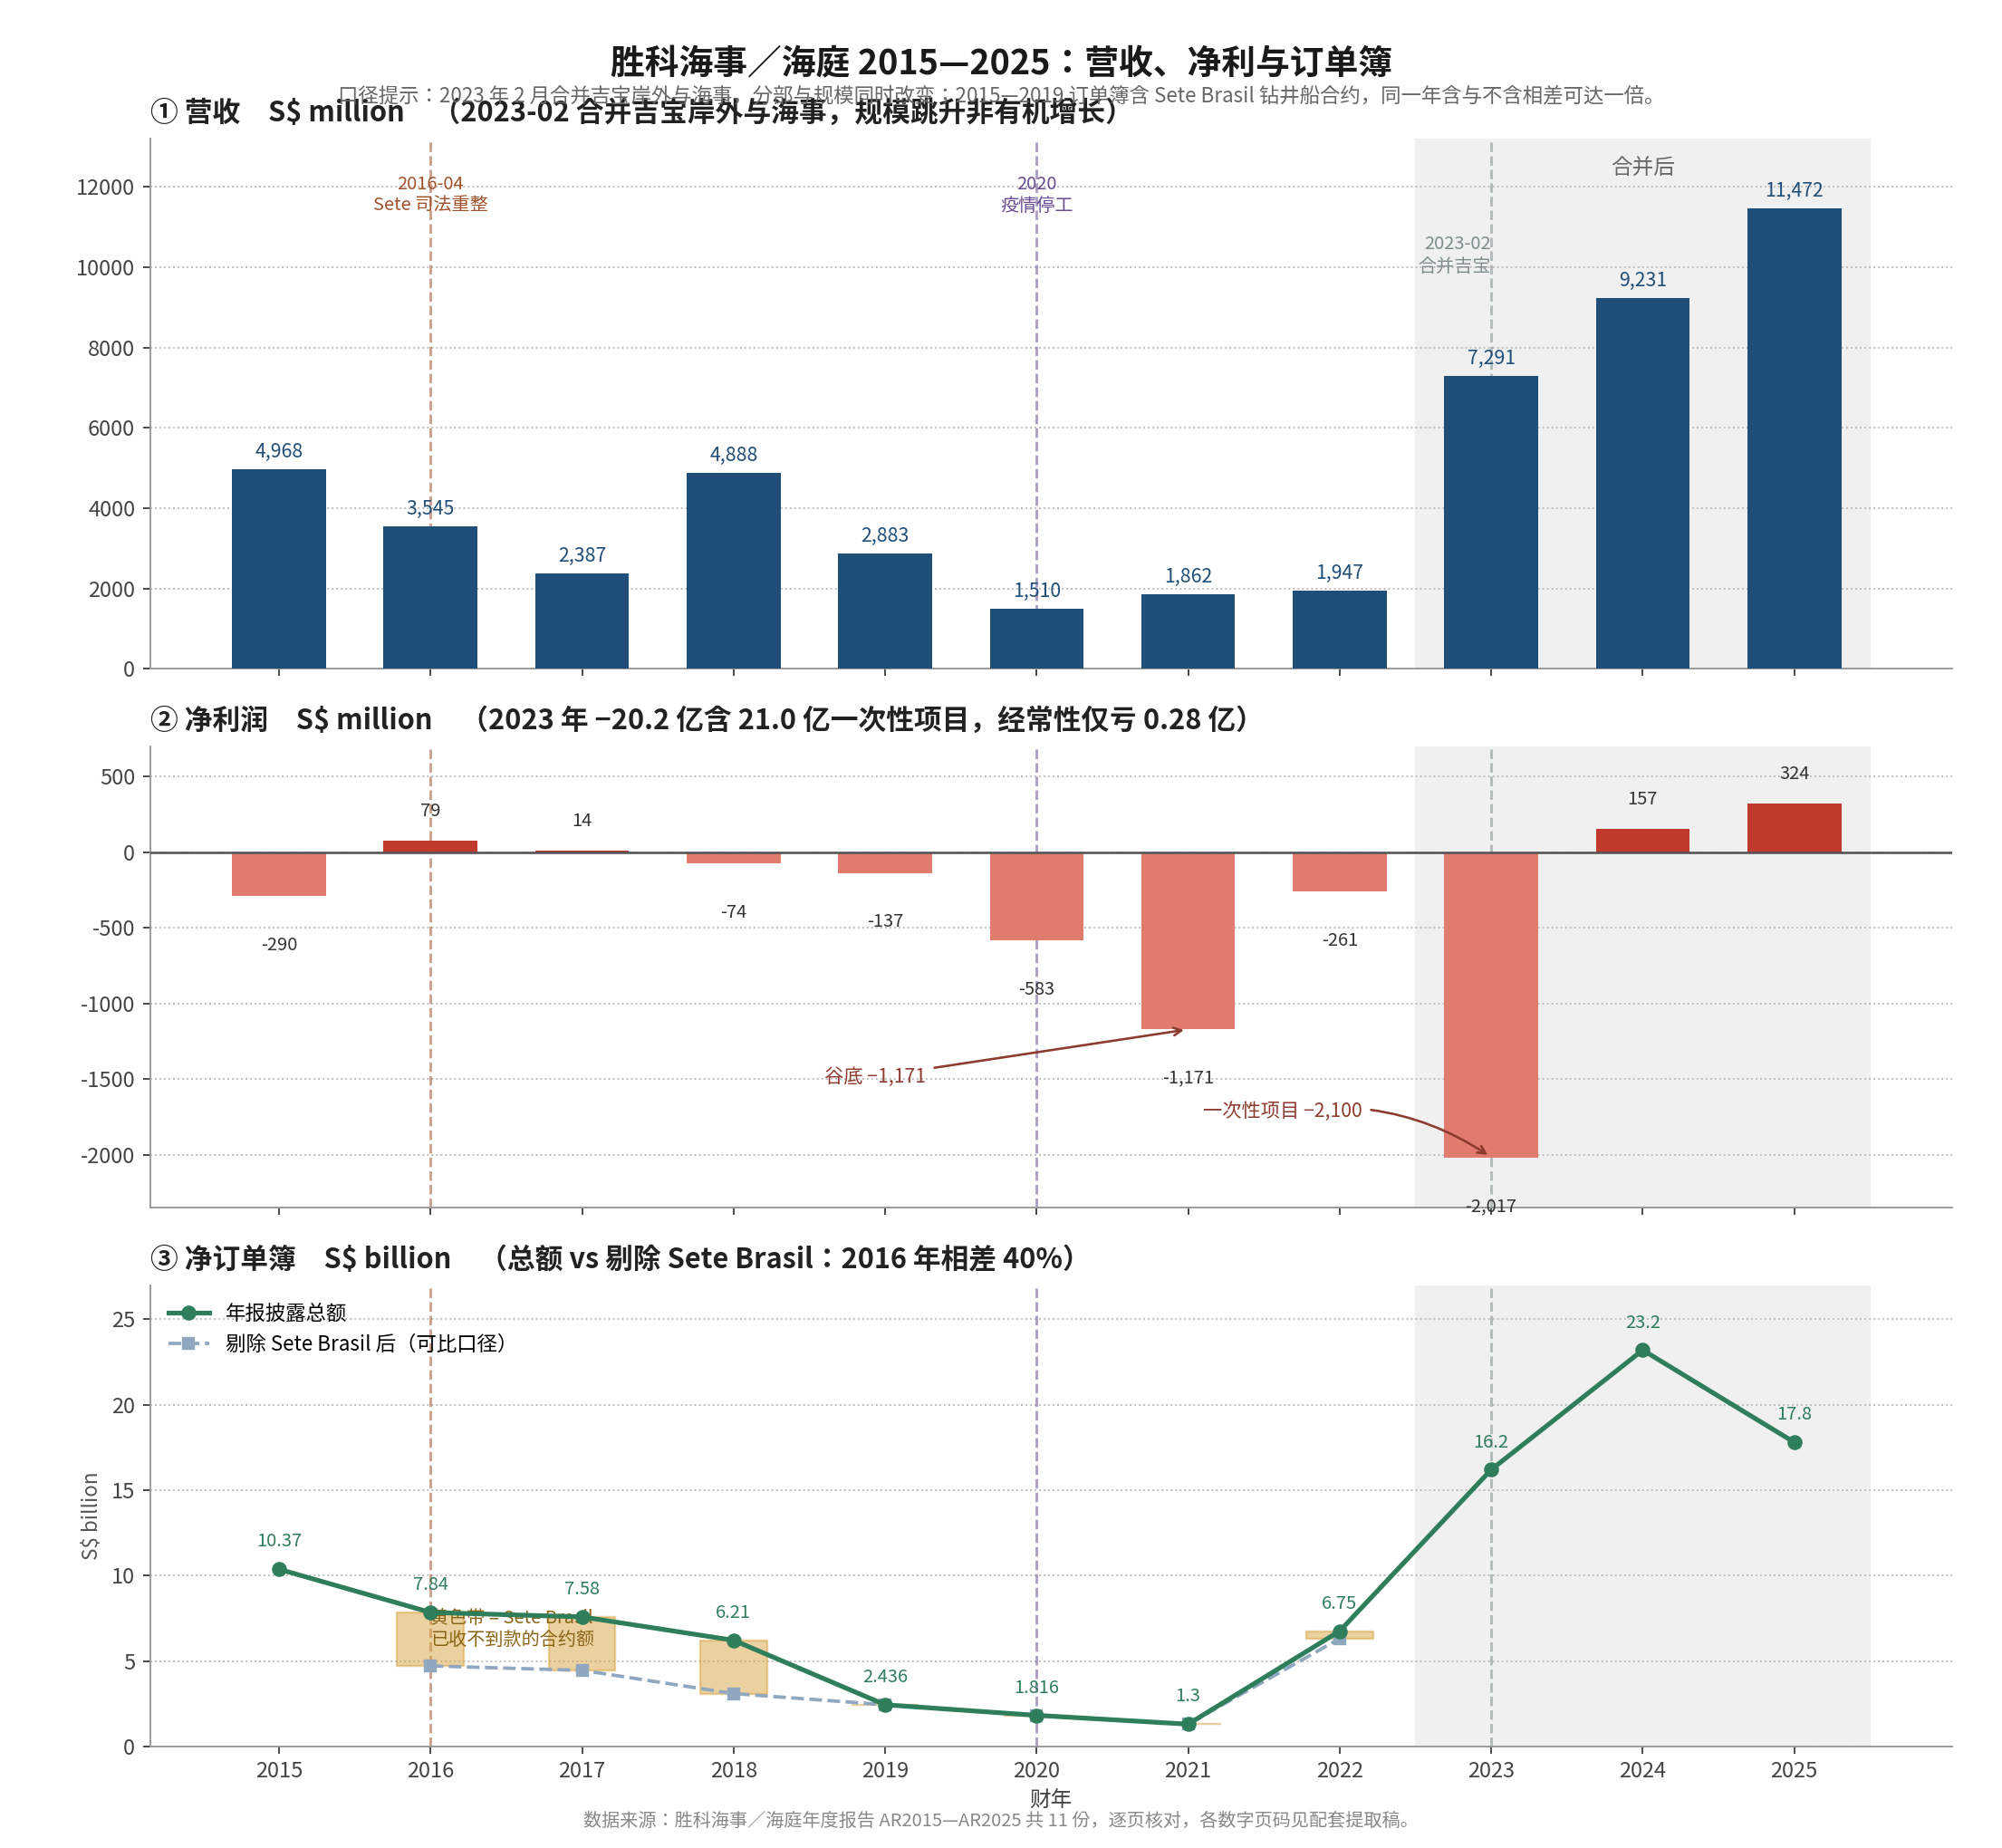
2. Group profit and loss ($'000)
| year | turnover | EBITDA | Operating profit and loss | Net profit/net loss |
|---|---|---|---|---|
| 2015 | 4,968,132 | −18,253 | −149,991 | −289,672 |
| 2016 | 3,544,816 | 384,251 | 225,306 | +78,777 |
| 2017 | 2,387,354 *(see note)* | 213,369 | 20,453 | +14,076 *(see note)* |
| 2018 | 4,887,866 | 143,123 | −52,323 | −74,131 |
| 2019 | 2,882,560 | 104,000** | −138,790 | −137,174 |
| 2020 | 1,510,280 | −380,000** | −581,545 | −582,510 |
| 2021 | 1,862,215 | −1,027,534 | −1,224,115 | −1,170,558 |
| 2022 | 1,947,195 | −6,634 | −206,444 | −261,141 |
There are two numbers in 2017, this is not a clerical error.
AR2017 reported 2,387,354, EBITDA 213,369, net profit 14,076; AR2018 restated 2017 as 3,034,767, EBITDA 498,626, net income 260,183, and mark in the table 2017#, footnote description:
"2017 financial data are prepared in accordance with SFRS(I) for comparison with 2018 and are labeled 2017# in tables and charts. "
(AR2018 page 33) The reason for the restatement is that Singapore fully adopted SFRS(I) (convergence with IFRS) in 2018, and the comparison period must be restated according to the new standard. Quoting 2017 must indicate which edition is used, otherwise two numbers appearing in the same indicator will be mistaken for data errors.
The restatement is huge: EBITDA changed from 213 million to 499 million (2.3x), and net profit changed from 14.08 million to 260 million (18x). In the five-year charts of subsequent annual reports, 2017 will be used after restatement Value (such as AR2020 page 28 EBITDA sequence 2016-2020 is 384/499/143/104/−380) —— 即The old and new sets of numbers coexist within the annual report, looking at the chart and looking at the annual report for that year will lead to different conclusions.
**EBITDA with \*\* is taken from the chart data row (rounded to the nearest million) **, the rest are report exact values.
2015 is also two numbers, but its properties are different from 2017
On page 34 of AR2015, two sets of numbers are arranged side by side on the same summary page:
| Impairment/Provision前 | Report caliber | |
|---|---|---|
| turnover | 5,134 | 4,968 |
| EBITDA | 591 | −18 |
| Operating profit and loss | 459 | −150 |
| Net profit/net loss | 384 | −290 |
Reason: Provision for impairment of inventories and work-in-progress and drilling platform losses of S$609 million was made during the year (including S$329 million for the Sete Brasil project),
In addition, 192 million share of associate/joint venture losses and impairment of available-for-sale financial assets.
The five-year table labels these two columns side by side as 2015 与 2015* (AR2015 page 35) ——This is two calibers juxtaposed on the same page, not a restatement.
When quoting 2015, it must be stated whether it is "pre-provision" or "reporting standard", otherwise 384 and −290 will seem to contradict each other.
(Comparison: The two sets of figures for 2017 are restatements of annual reports, see the previous section.)
3. Segment turnover ($ million)
| year | Rig Building | Floaters | Repairs & Upgrades |
|---|---|---|---|
| 2015 | 2,428 | 891 | 557 |
| 2016 | 1,049 | 838 | 460 |
| 2017 | 1,073 | 644 | 499 |
| 2018 | 3,086 | 1,061 | 476 |
| 2019 | 822 | 1,247 | 605 |
| 2020 | 156–158 | 517 | 425 |
| 2021 | 160 | 643 | 396 |
| 2022 | 173 | 900 | 506 |
Source: AR2015 page 47, AR2019 page 38–39, AR2020 page 33–34, AR2021 page 32–33, AR2022 page 32, 35 (data rows below chart).
Cross-validation (2015) : Rig Building 2,428 + Floaters 891 = 3,319, consistent with the text "Rigs & Floaters revenue 3.32 billion" on page 19 of AR2015 (the tail difference is rounded). The segment table and the text can be mutually verified.
2015 revenue structure (AR2015 page 47): Rigs & Floaters 67%, Offshore Platforms 20%, Repairs & Upgrades 11%, Others 2%. In 2014 it was 72%/16%/11%/1%.
2014 Two other divisions (AR2015 pp. 19, 47): Rigs & Floaters 4.21 billion (→2015 3.32 billion, 降 21%), Offshore Platforms 925 (→2015 1,017), Repairs & Upgrades 622 (→2015 557).
Note: 2015 Rig Building 2,428 + Floaters 891 = 3,319 ≈ 3.32 billion of the main text; and 2014 only appears in the main text as the total number of Rigs & Floaters (4.21 billion), without the two-digit split number of 2014, so the split number is not filled in the 2014 row in the table.
2020 Rig Building has two values 156 and 158: The chart on page 33 of AR2020 is written as 158, and the comparison period on page 32 of AR2021 is written as 156. It is a slight restatement across years and is not a transcription error.
There are two other divisions not listed in full: Offshore Platforms and Specialized Shipbuilding are not given in the form of data rows in some year charts, only text exposition (such as "Specialized Shipbuilding 2021 revenue S$33 million, 2020 is S$56 million", page 34 of AR2021). This is not pieced together.
4. Net Order Book (Net Order Book)
| time point | net order book | Remark |
|---|---|---|
| 2015 末 | $10.37 billion | Deliveries are scheduled to 2020; about 2 billion are post-payment drilling rigs, with an average advance payment of nearly 30% (AR2015 page 22) |
| 2016 末 | $7.84 billion | Including Sete Brasil drillship; approximately $4.7 billion excluding |
| 2017 末 | $4.45 billion | Eliminate Sete Brasil drillship (footnote on page 46 of AR2017) |
| 2018 末 | $6.21 billion | Contains Sete Brasil; after removal $3.09 billion (AR2018 page 48) |
| 2019 末 | $2.436 billion | Eliminate Sete Brasil (AR2019 page 45) |
| 2020 末 | $1.816 billion | = $1.51 billion in execution + $0.31 billion in ship repairs and modifications (AR2020 page 38) |
| 2021 末 | S$1.30 billion | AR2021 Page 37 |
| 2022 末 | S$6.75 billion | = Executing project 6.31 + Ship repair and modification 0.44; Of which renewable wind energy and clean solutions account for approximately S$2.5 billion, accounting for 37% (AR2022 page 41) |
The calibers from 2016 to 2019 are inconsistent and cannot be directly connected into a curve. The Sete Brasil drilling ship contract was included in 2016 and 2018, and was explicitly eliminated in 2017 and 2019. From 2020 onwards, the "in execution + ship repair" caliber will be used. In the same year (2018), there is a double difference between the included and excluding contracts (6.21 vs 3.09). Looking at "order book fell from 7.8 billion to 1.8 billion" alone would exaggerate the decline, because the starting point and the end point are not the same ruler.
The chart data rows give an additional set of series (AR2020 page 38): 2016 4,709 / 2017 5,225 / 2018 3,088 / 2019 2,436 / 2020 1,816 ($ million) - this isComparable calibers excluding Sete Brasil, coexisting with the main text of the above table. The same chart on page 45 of AR2019 is written for 2017 5,255, a difference of 30 from AR2020’s 5,225, and is a restatement.
5. Ship repair volume (Repairs & Upgrades workload)
| year | Number of ships | original | 页 |
|---|---|---|---|
| 2014 | 439 | 「compared with 439 in FY2014」 | AR2015 p22 |
| 2015 | 453 | 「the Group repaired and upgraded a total of 453 vessels in FY2015, compared with 439 in FY2014」 | AR2015 p22 |
| 2016 | 469 | 「the Group repaired a total of 469 vessels」 | AR2016 p43 |
| 2017 | 390 | 「the Group repaired a total of 390 vessels compared with 469 vessels」 | AR2017 p43 |
| 2018 | 296 | 「296 SHIP REPAIR AND UPGRADE PROJECTS」 | AR2018 p6 |
| 2019 | 280 | 「It serviced 280 vessels with an average per-vessel revenue of $2…」 | AR2019 p43 |
| 2020 | 146 | 「Revenue was recognised from 146 vessels in FY2020 including floating storage and…」 | AR2020 p32 |
| 2021 | 144 | 「some 144 vessels requiring repair, upgrade and maintenance」 | AR2021 p73 |
| 2022 | 221 | 「the Group serviced a total of 221 vessels, a 53% increase from 144 vessels」 | AR2022 p35 |
The 296 in 2018 is the "number of projects" not the "number of ships" (The original text uses projects), which is different from other years and cannot be directly compared.
The 221/144 (+53%) reported in 2022 and the 144 reported in 2021 corroborate each other, and the credibility is high.
Sixth, what can really be checked in Jurong’s annual report: Brazilian shipyard EJA
It said earlier that "there is no independent financial data for Jurong", but there is one exception, and it is closer to what you are looking for than Jurong Singapore itself.
Estaleiro Jurong Aracruz Ltda (EJA) is a wholly-owned subsidiary of Jurong Shipyard and is not directly owned by Sembcorp Marine.
The structure of the subsidiary table is hierarchical:
Jurong Shipyard Pte Ltd(Singapore, 100%)
→Subsidiaries of Jurong Shipyard Pte Ltd
→Jurong Aracruz Shipyard Ltda(Brazil, 100%)
(AR2015 page 257, AR2016 page 274, AR2018 page 316, AR2020 page 206, AR2022 page 202)
Also: Jurong's plant in Brazil is invested by Jurong Shipyard itself, and Sembcorp Marine is an indirect shareholder. This explains why the Brazilian shipyard has Jurong in its name.
The scale and construction of EJA (AR2015 page 32)
- 83 hectares, coastline 1.6 km
- Facilities: Warehouse, mechanical and electrical workshop, hull workshop (including painting, sandblasting, pretreatment, and segmented assembly capabilities)
- expected 2016 Completed; office building opened in 2015
- First project: Drillship for Brazilian presalt exploration NS Arpoador, living quarters fabricated and assembled in Singapore
- Do Petrobras FPSO at the same time P-68 与 P-71 eight modules
This paragraph is a text description, not a numerical sequence. There is no revenue, profit or delivery volume of EJA in the annual report - the reason is the same as Singapore Jurong: The accounting level is not a legal entity. But at least the fact that "the Jurong system contains a Brazilian shipyard, 83 hectares" can be confirmed.
Two subsequent events of EJA (both are included in the note "Contingent Liabilities" in the annual report)
- election litigation: Brazilian Public Prosecutor 2015 indicts EJA in Aracruz electoral court over 2014 political donations 1.75 million reais (approximately S$470,000) exceeding the legal limit. June 2021 District Court sentenced 8.57 million reais (approximately S$2.33 million), EJA denied and appealed to the High Electoral Court (AR2022 pp. 194–195)
- arbitration: On 2021-12-24, Jurong Shipyard (JSPL) received four arbitration cases filed by an equipment supplier regarding four contracts, claiming about 76 million US dollars (approximately S$103 million), JSPL claimed and defended that the contract had been effectively suspended or terminated (AR2022 page 195)
7. Sete Brasil: A risk line running through eight annual reports
If we only look at revenue, Sembcorp Marine's 2015-2022 period is "decline-trough-recovery". But the real causal chain lies in Sete Brasil.
Chronology of events (with sources for each item)
| time | event | Source |
|---|---|---|
| 2012 | Sign with Sete Brasil 7 drillshipscontract, contract amount US$5.6 billion | AR2017 p11 |
| 至 2014-11 | Cumulative progress payments received US$2.70 billion | AR2016 p21, AR2017 p11 |
| 2014-11 | Sete Brasil Stop Payment | AR2016 p21 |
| 2015 | Provision S$329 millionProvisions (another 280 million is for other drilling platform projects) | AR2015 p34, p46 |
| 2015 | Stop all drilling ship construction and shift to protecting the value of work-in-progress | AR2016 p21 |
| 2016-04-29 | Sete Brasil Applyjudicial reorganization (judicial restructuring), submit a reorganization plan to the Brazilian court | AR2016 p21, AR2017 p11 |
| 2017-10 | 9 seater Pacific Class 400 jack up platform for sale to Borr Drilling, approx. US$1.3 billion + Variable fee based on value added, down payment US$500 million | AR2017 p11 |
| 2018-03 | Media reports Sete Brasil reached preliminary agreement with Petrobras to lease 4 drilling platforms | AR2017 p11 |
| 2018-11 | Sete Brasil Judicial reorganization plan approved by creditors | AR2018 p12 |
| 2019-10 | Announced with Sete Brasil comprehensive final settlement (full and final settlement), covering all claims in 7 contracts | AR2019 p13 |
| 2019 | According to settlement: reserved 5 艘ownership; remainder 2 艘 (at a later stage of construction) shall be distributed between the parties in proportion to the amount received; and the arbitration shall be terminated at the same time | AR2019 p13 |
| 2020—2022 | Sete Brasil only appears in the “Contingent Liabilities” note, relating to the 2012 contractCorruption and Money Laundering Criminal Cases (related to EJA), no longer affects operations | AR2020 p211, AR2021 p200, AR2022 p209 |
Why this line is more explanatory than the revenue curve
1. The root cause of the "dual-track" phenomenon of the order book is here.
The order book at the end of 2016 was 7.84 billion, excluding Sete Brasil, only 4.71 billion; 7.58 billion at the end of 2017, after excluding 4.45 billion; 6.21 billion at the end of 2018, after excluding 3.09 billion. Sete Brasil contract value given in the footnote of the annual report for the same period: 2016 3.1 billion, 2017 3.13 billion. This 3.1 billion is something that is on the books, but no money has been received.——It accounted for 20% of the order book at the end of 2016 40%.
2. The time point and magnitude of impairment.
In 2015, a one-time provision of 329 million (Sete Brasil part) was made, and the net loss on the reporting basis for that year was 290 million; if the provision is excluded, the net profit was 384 million. In other words, in 2015 this company still made money from its operations, and all its losses came from this one customer.
3. Changes in the presentation of subsequent annual reports are signals in themselves.
Number of times Sete Brasil appears in annual reports: 4 times in 2015 → 12 times in 2016 → 13 times in 2017 → 7 times in 2018 → 6 times in 2019 → 1 time per year starting from 2020. After 2020, there is only a criminal case statement in the legal note, and the operational level has been completely cleared.
The caliber limit for this line
- Whether the 329 million provision is "enough" is a matter of management judgment., the annual report repeatedly uses "remain adequate under the present circumstances", which is not an audit conclusion.
- The specific amount of the settlement was not disclosed in the annual report.——It only says "retain the ownership of 5 ships, and distribute 2 ships according to the payment ratio", without the consideration figure. Any statement of "recovering X billion in settlement" cannot be supported in the annual report
- The 329 million in 2015 and the subsequent settlement are not the same thing: The former is an accounting provision and the latter is a legal arrangement. They cannot be subtracted to calculate the "final loss".
8. After the merger with Keppel (2023-2025): The caliber has completely changed
February 28, 2023, the merger with Keppel Offshore & Marine (now Seatrium Offshore & Marine Limited) was completed.
It's not just a change in scale, The caliber of the division was also changed accordingly.:
- 旧 (2015—2022): Rigs & Floaters / Repairs & Upgrades / Offshore Platforms / Specialised Shipbuilding
- 新 (2023 起): Floating Solutions / Fixed Solutions / Repairs & Upgrades
The two sets of branches cannot be connected. The old "Rig Building" was split into Floating Solutions in the new caliber, and there is no one-to-one mapping relationship.
Group profit and loss (S$'000)
| year | revenue | EBITDA | Operating profit and loss | Net profit/net loss |
|---|---|---|---|---|
| 2023 | 7,291,488 | 236,363 | −1,572,649 | −2,016,717 |
| 2024 | 9,230,702 | 627,000* | 212,452 | +156,838 |
| 2025 | 11,471,675 | 837,000* | 513,510 | +323,621 |
\* EBITDA for 2024, 2025 taken from summary chart (S$627M, S$837M); the rest are reported exact values.
Net loss in 2023 is 2.02 billion, the largest loss in the range, but the nature is different from 2020-2021: that year Exceptional Items up to 2.1 billion
(Including impairment, onerous contract provisions, legal and corporate claims, merger expenses), Excluding recurring net losses, the net loss was only 28 million (AR2023 p24).
in other words: The huge losses in 2023 are due to the accounting cleanup caused by the merger, not the deterioration of operations. Under the same caliber, 2023 recurring EBITDA is 628 million, has returned above 2019 levels.
Segment revenue (S$ million)
| year | Floating Solutions | Fixed Solutions | Repairs & Upgrades |
|---|---|---|---|
| 2022 | 1,097 | 283 | 506 |
| 2023 | 5,028 | 1,064 | 1,035 |
Source: AR2023 pages 24, 25. 2024, 2025 The complete sequence of these two divisions is not given in the data line, only in the text and figures → Not pieced together.
2023 Revenue Structure: Floating Solutions 69%, Repairs & Upgrades 15%, Fixed Solutions 14%, other 2% (AR2023 p24).
Net order book (S$ billion)
| time point | net order book | Number of items | Delivery scheduled to | Renewable/clean ratio |
|---|---|---|---|---|
| 2022 末 | 6.75 (in operative part 6.31) | — | — | 约 37% |
| 2023 末 | 16.2 | 27 | 2030 | 39% |
| 2024 末 | 23.2 | — | — | 34% |
| 2025 末 | 17.8 | 24 | 2033 | 40% |
The 6.75 and 6.31 at the end of 2022 are not two numbers, but two calibers of the same number.
AR2022 Part 41 Original text: “The Group had a net order book of S$6.75 billion as at end-December 2022.
This consists of S$6.31 billion of projects under execution (with a total original contract sum of S$7.07 billion)
and S$0.44 billion of ongoing Repairs & Upgrades projects.」
That is 6.31 + 0.44 = 6.75. And the bar chart on page 31 of AR2023 compares to FY2022 6,314,
The contrast isOnly included in executive projectscaliber, so it looks “400 million less”.
When quoting, it must be stated whether it includes ship repair and modification, otherwise 6.75 and 6.31 will be mistaken as data that does not match.
(Also: The original contract total amount of S$707 million is higher than the net execution value of S$6.31, and the difference is the recognized revenue portion.)
The order book “gross vs. net” trap has an example on the same page: The 4 projects in 2030 and beyond, gross value 11.088 billion, net value 8.499 billion,
The difference is 2.589 billion; while In 2026, the gross value of 9 projects is 5.807 billion, and the net value is only 376 million., 差 93.5%.
The reason is that the 2026 batch is nearly completed and most of the revenue has been recognized. Treating the gross value as orders on hand would be a serious overestimation.
16.2 → 23.2 → 17.8 in 2023 → 2024 → 2025 is not "order loss".
This is the lead time: 2025 delivered >S$4B project (AR2025 p14), the order book naturally fell back,
However, new orders and projects signed during the same period have extended the delivery schedule from 2030 to 2033 . Looking at the order book without looking at the delivery schedule will misinterpret execution as shrinking.
End of 2025 order book structure (AR2025 p15):
| Delivery year | Number of items | gross value | net worth |
|---|---|---|---|
| 2026 | 9 | 5,807 | 376 |
| 2027 | 6 | 9,808 | 2,685 |
| 2028 | 3 | 5,786 | 2,606 |
| 2029 | 2 | 7,076 | 3,675 |
| 2030 and beyond | 4 | 11,088 | 8,499 |
| total | 24 | 39,565 | 17,841 |
The difference between gross value 39.57 billion and net value 17.84 billion is 21.7 billion, because "net" has deducted unrecognized joint venture shares, unsigned options, etc.
When quoting, you must indicate which one is used, as the difference between the two is more than double.
Ship repair volume
| year | quantity | Original text ≠ unit | 页 |
|---|---|---|---|
| 2023 | 291 | 「completed 291 Repairs & Upgrades projects」 | AR2023 p25 |
| 2024 | 231 | 「completed and worked on 231 repairs and upgrades projects」 | AR2024 p46 |
| 2025 | 185 | 「delivered 185 repair and upgrade projects」 | AR2025 p23 |
Starting from 2023, the caliber will be changed from "ship" to "project", and the ship number sequence from 2016 to 2022 Not directly connected.
Also: 2023 included in 291 projects 46 low carbon projects; included in 2024 231 49 Low Carbon/Energy Saving Modifications.
2025 gives mid-term goals for the first time (AR2025 p22)
| index | FY2025 Actual | FY2028 Target |
|---|---|---|
| revenue | S$11.5B | S$10–12B |
| EBITDA | S$837M | ≥S$1.0B |
| ROE | 4.9% | ≥8% |
| Gross profit margin | 7.4% | mid-teens |
This is the first time that "quantitative targets set by the company itself" appear in the entire range, which can be used as a benchmark for subsequent verification.
9. Key nodes that can be directly cited
- - 2015: Turnover 4.97 billion (reporting basis), net loss 290 million; net profit before provisions 384 million; order book 10.37 billion is the peak value of the interval; New orders received that year were 3.17 billion
- 2016: Turnover is S$3.54 billion, net profit is 78.78 million; Rigs & Floaters accounts for 53% of the group’s revenue (AR2016 p38 chart)
- 2018: Revenue rebounded to 4.89 billion, but operating loss turned to 52.32 million, net loss 74.13 million (SFRS(I) first application year)
- 2020: Net loss of 583 million, mainly due to the epidemic shutdown and impairment; completed a SGD 2.1 billion rights issue in September of the same year
- 2021: Net loss was 1.17 billion, the worst in the range; order book dropped to bottom of S$1.30 billion
- 2022: Net loss narrowed 78% to 261 million; new contracts for the year exceeded S$7 billion; order book rebounded to S$6.75 billion
- 2023-04: Renamed Seatrium (Haiting), code S51 → 5E2
10. What this extraction failed to accomplish (must be marked honestly)
- No independent financial data for Jurong Shipyard ——The annual report is not calculated by shipyard, and this data does not exist in public disclosure.
- No 2014 and before —— AR2015 is the lower limit of the site’s annual report. Measured:
/misc/agm/2016/AR_2015.pdf,Sembcorp-Marine-AR2015.pdf,ar2015.pdfAll three naming methods are returned 404 (236 bytes) ;The words appearing in the page from 2010 to 2014 are allCircular , not an annual report. There are 11 annual report records in the announcement index (AR2015-AR2025), the earliest one is 2016-03-23, which is AR2015 - Offshore Platforms / Specialized Shipbuilding segment sequence is incomplete ——In some years, only textual essays are available
- Order book caliber is not consistent across years ——Already listed in the fourth quarter, no forced equalization
- Original PDF layout not checked ——All data is taken from the PDF text layer. There may be some serialization in the table column alignment. It is recommended to return to the original PDF according to the page number in the table above for key figures to review.
- EJA has no independent financial data ——Similar to Jurong, Singapore, the annual report is not calculated according to legal entities; it only contains area, facilities, project names, and no revenue.
- Sete Brasil settlement for undisclosed price ——Only a structural description of "retain 5 ships and distribute 2 ships in proportion"; do not speculate on the amount
- Starting from 2023, the branch caliber cannot be connected with the previous one. - Floating/Fixed Solutions cannot be mapped back to Rigs & Floaters; drawing continuous curves across 2022/2023 is wrong
- The ten-year chart of the order book cannot be reliably broken down —— There is a ten-year chart from 2015 to 2024 on page 47 of AR2024 (visible 5.1, 6.4, 6.8, 10.5, 11.5, 11.5, 16.2, 17.8, 19.4, 23.2), but the values output by the text layer cannot be reliably matched with the year. Therefore do not write in the form;If you need to see the picture, please go back to the original PDF page 47
*Extraction date: 2026-11-03. The page numbers are in PDF physical page order, which may differ by about 4 pages from the printed page numbers of the annual report (previous attached page). *